Observability Configuration
Observability for the Vald cluster helps to check each Vald component status by monitoring metrics, logs, and traces. By enabling observability, you can monitor and visualize the number of indexes, the timing of creating indexes, the number of RPC, CPU resource usage, Memory resource usage, events, etc.
This page shows the best practice for applying observing features by constructing an observability environment and setting the Vald Helm chart.
Architecture
Vald conforms OpenTelemetry Protocol and does NOT depend on any commercial data format.
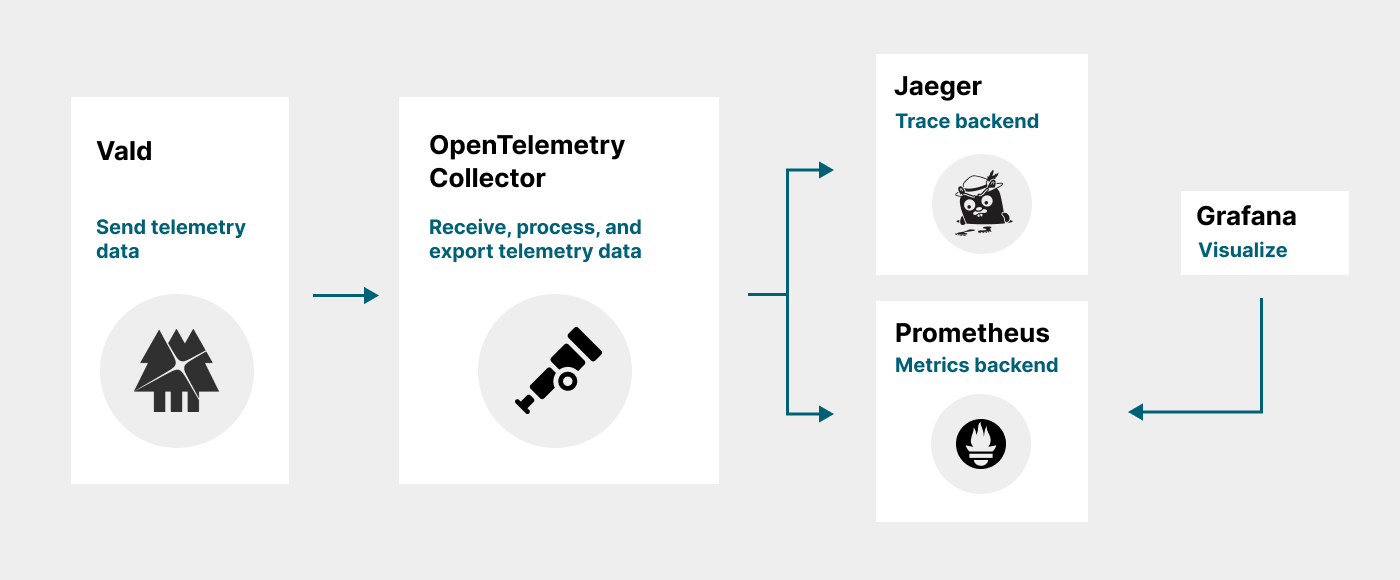
OpenTelemetry Collector handles receiving / processing / exporting the telemetry data, which does NOT depend on the vendors’ format. All Vald components can send OTLP-compliant telemetry data, like metrics, traces, or logs, to the OpenTelemetry Collector. The telemetry data is used to monitor or visualize with the observing tools.
Build an observing environment
The recommended observability environment consists of the following:
- Cert-Manager
- Jaeger Operator and Jaeger
- Prometheus Operator and Prometheus
- Grafana
- OpenTelemetry Operator and OpenTelemetry Collector
Vald provides the default manifests and the make commands for deploying those components. Please refer to the following sections to deploy each component.
Cert-Manager
A Cert-Manager is required to enable to use of operators on the Kubernetes Cluster.
make k8s/external/cert-manager/deploy
Jaeger Operator and Jaeger
Jaeger is helpful for monitoring trace data. It can be available by running the following:
make k8s/metrics/jaeger/deploy
Prometheus Operator and Prometheus
Vald recommends using Prometheus as a backend service by the following command to monitor the metrics data.
make k8s/metrics/prometheus/operator/deploy
Grafana
Vald recommends using Grafana to visualize metrics data.
make k8s/metrics/grafana/deploy
OpenTelemetry Operator and OpenTelemetry Collector
Vald uses OpenTelemetry Collector to get the telemetry data and export it to monitor backend components. The following command deploys OpenTelemetry Collector via OpenTelemetry Collector.
make k8s/otel/operator/deploy k8s/otel/collector/deploy
Deploy Observability components with a simple command
If you would like to deploy observability components with a simple command, please use the following command.
make k8s/external/cert-manager/deploy k8s/monitoring/deploy
Configure Helm chart
This section shows how to set values.yaml to enable each Vald component to send its own telemetry data.
The setting points are the following:
- Enable observability feature
- Enable sending system metrics
- Enable sending trace data
- Set OpenTelemetry parameters
Enable observability feature
To enable the observability feature, you must set defaults.observability.enabled as true.
defaults:
  observability:
    # enable observability
    enabled: true
Enable sending system metrics
Each Vald component sends the system metrics by editing defaults.observability.metrics.
All metrics are enabled by default.
Vald recommends using default values unless there is a specific reason.
defaults:
  observability:
    # enable version info metrics
    metrics:
      enable_version_info: true
      # If the enable_version_info setting is true, this information will be added to the keys of the version info metrics.
      version_info_labels:
        - "vald_version"
        - "server_name"
        - "git_commit"
        - "build_time"
        - "go_version"
        - "go_os"
        - "go_arch"
        - "algorithm_info"
      # enable memory metrics
      enable_memory: true
      # enable goroutine metrics
      enable_goroutine: true
      # enable cgo metrics
      enable_cgo: true
Enable sending trace data
Please set defaults.observability.trace.enabled as true to enable sending trace data.
The default value is false.
defaults:
  observability:
    trace:
      # enable to send trace data
      enabled: true
OpenTelemetry settings
This section shows the detailed settings for sending telemetry data.
Specify OpenTelemetry Collector endpoint
To send the telemetry data, you must set the OpenTelemetry Collector’s endpoint to defaults.observability.otlp.collector_endpoint.
The default value is not set.
defaults:
  observability:
    otlp:
      collector_endpoint: "opentelemetry-collector-collector.default.svc.cluster.local:4317"
Specify the Telemetry attribute
You can add the component information to the attribute of telemetry data by editing defaults.observability.otlp.attribute.
E.g., when setting vald-agent-ngt-0 as agent.observability.otlp.attribute.pod_name, target_pod: vald-agent-ngt-0 will be added to the attribute.
These attributes are set auto by the environment values, so Vald recommends using default values unless there is a specific reason.
defaults:
  observability:
    otlp:
      attribute:
        # deployed namespace
        namespace: vald
        # pod name
        pod_name: vald-agent-ngt-0
        # deployed node name
        node_name: kube-worker01
        # service name
        service_name: vald-agent-ngt
Customize send configuration
You can modify the sending telemetry data behavior by changing the default.observability.otlp parameters.
defaults:
  observability:
    otlp:
      # Maximum duration for constructing a batch from the queue. The Processor forcefully sends available spans when timeout is reached.
      trace_batch_timeout: "1s"
      # Maximum duration for exporting trace spans
      trace_export_timeout: "1m"
      # Maximum batch size of trace spans.
      trace_max_export_batch_size: 1024
      # Maximum queue size to buffer trace spans for delayed processing.
      trace_max_queue_size: 256
      # Export interval for metrics
      metrics_export_interval: "1s"
      # Maximum duration for exporting metrics
      metrics_export_timeout: "1m"
gRPC Configuration
The interceptor configuration is required to send the metrics and trace data related to gRPC.
You can add the interceptor to the server-side and client-side by editing defaults.server_config.servers.grpc.server.grpc.interceptors parameters.
defaults:
  server_config:
    servers:
      grpc:
        server:
          grpc:
            # gRPC Server interceptor.
            interceptors:
              - TraceInterceptor
              - MetricInterceptor
  grpc:
    # gRPC Client interceptor.
    client:
      dial_option:
        interceptors:
          - TraceInterceptor
Monitoring telemetry data
Telemetry data can be monitored using Grafana, Jaeger, etc. Vald publishes the sample manifest, which enables Grafana and Jaeger.
You can apply it after creating an observability environment.
You can monitor the browser by port forwarding or define the ingress host by yourself.
Cleanup
Lastly, the Vald cluster will be removed by executing the following command.
helm uninstall vald
Also, the observability components will be removed by executing the following command.
make k8s/monitoring/delete k8s/external/cert-manager/delete
And the observability components can also be removed by executing the following command.
make k8s/otel/collector/delete \
  k8s/otel/operator/delete \
  k8s/metrics/grafana/delete \
  k8s/metrics/jaeger/delete \
  k8s/metrics/prometheus/operator/delete \
  k8s/external/cert-manager/delete