Operations
This page introduces best practices for operating a Vald cluster.
Deployment
Kubernetes cluster
Since Vald agents stores vector data on their memory space, unexpected disruption or eviction of agents may cause loss of indices. Also, disruption or deletion of worker nodes that have Vald agents may cause loss of indices. If you need to prevent low accuracy effects caused by indices loss, it is better to increase the number of nodes and pods.
However, to maximize the efficiency of search operations, it is better to have a certain amount of vectors in each NGT vector space.
We recommend having more than 3 worker nodes with enough memory for the workload.
Deploying 2 or 3 Vald agent pods to each worker node is better.
If you want to store 100 million vectors with 128 dimensions, 8 bytes (64bit float) x 128 (dimension) x 100 million x N replicas, 100 GB x N memory space is needed.
If the number of index replicas is three, which means N=3, the total amount of memory space for the whole cluster will be 300 GB at least.
For example:
- 10 worker nodes with 24 GB RAM and 3 Vald agents on each worker node (total: 240 GB RAM, 30 Vald agents)
- 20 worker nodes with 16 GB RAM and 2 Vald agents on each worker node (total: 320 GB RAM, 40 Vald agents)
On multi-tenant cluster
If you’re going to deploy Vald on the multi-tenant cluster, please take care of the followings.
- It is recommended to define PriorityClasses for agents not to be evicted.
- For more info, please visit the page Pod Priority and Preemption.
- If you are using the Vald chart, PriorityClasses are defined by default.
- Defining unique namespaces for each Vald and the other apps are recommended.
- Then, please define ResourceQuotas for the namespace for the other apps to limit their memory usage.
- For more info, please visit this page, Resource Quotas.
Monitoring
Logging
The logging level of Vald components can be configured by defaults.logging.level (or [component].logging.level) field in Helm Chart values.
The level must be a one of debug, info, warn, error, and fatal.
The levels are defined in the Coding Style document.
Observability features of Vald
The observability features are useful for monitoring Vald components. Vald has various exporters, such as Prometheus, Jaeger, etc. Using this feature, you can observe and visualize the internal stats or the events, like the number of NGT indexes, when to createIndex, or the number of RPCs.
Enabling observability feature
By setting defaults.observability.enabled (or [component].observability.enabled) in the Helm Chart value set to true, the observability features become enabled.
If observability features are enabled, the metrics will be collected periodically.
The duration can be set on observability.collector.duration.
If you’d like to use the tracing feature, you should enable it by setting observability.trace.enabled set to true. The sampling rate can be configured with observability.trace.sampling_rate
Monitoring Vald cluster using Prometheus and Grafana
In this section, an example of monitoring the Vald cluster using Prometheus and Grafana will be shown.
Vald configuration
To use the Prometheus exporter, you should enable it by setting both observability.prometheus.enabled and server_config.metrics.prometheus.enabled set to true.
The exporter port and endpoint are specified in each server_config.metrics.prometheus.port and observability.prometheus.endpoint.
Now it’s ready to scrape Vald metrics. Please deploy Prometheus and Grafana to your cluster.
Deploy Prometheus
Prometheus can be installed using one of the following.
If you use Prometheus Operator, it is required to set configurations properly along with Prometheus Configuration page. It is recommended to use the endpoints role of the service discovery.
Deploy Grafana
Grafana can be installed using one of the following.
It is required to set your Prometheus to a data source.
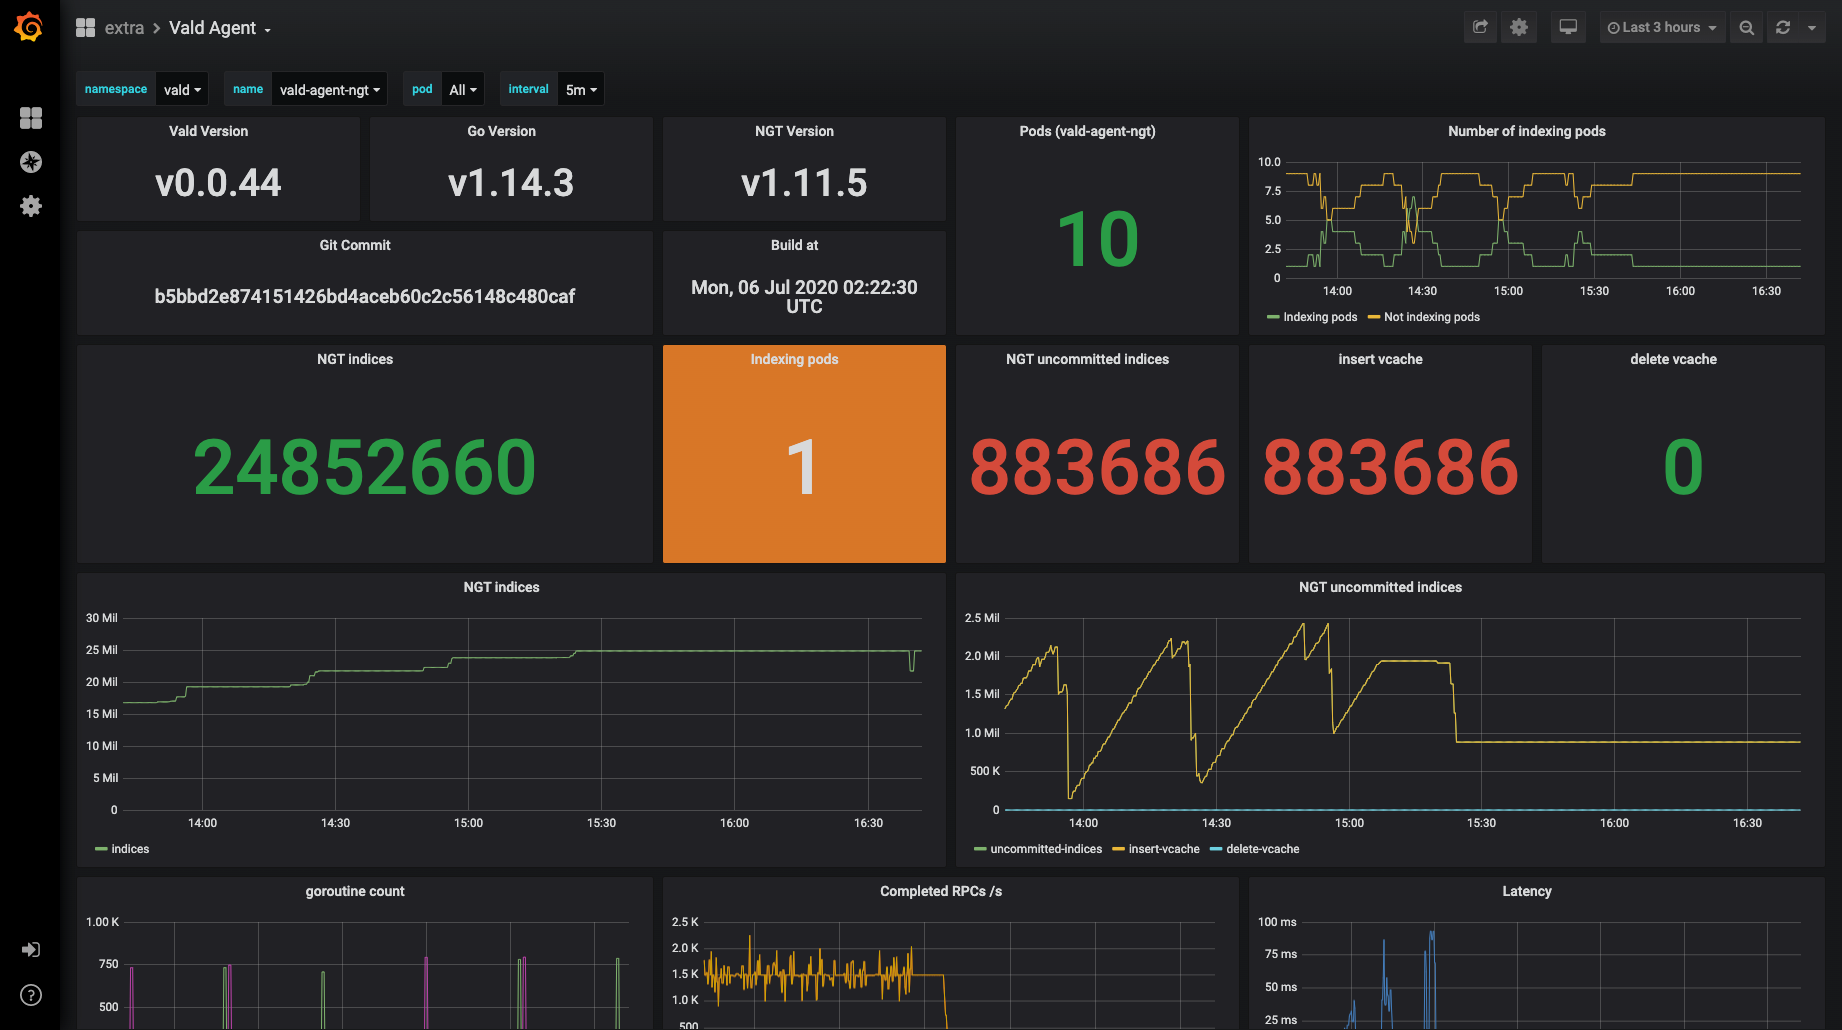
Example dashboard
Now you can construct your own Grafana dashboard to monitor Vald metrics. This is an example of a custom dashboard. It is based on our standard dashboard settings.
Upgrading
Our versioning strategy is based on Semantic Versioning. Upgrading to a new version, such as minor or major, may require changing your configurations. Please read the CHANGELOG before upgrading.
In case of manual deploy
In manual deployments, it is generally required to update your ConfigMaps first. After that, please update the image tags of Vald components in your deployments.
In case of using Helm
In case of using Helm and Vald’s chart, please update defaults.image.tag field and install it.
In case of using Vald-Helm-Operator
If using Vald-Helm-Operator, please upgrade the CRDs first because Helm doesn’t have support to upgrade CRDs.
VERSION=v1.4.1
kubectl replace -f https://raw.githubusercontent.com/vdaas/vald/${VERSION}/charts/vald-helm-operator/crds/valdrelease.yaml && \
kubectl replace -f https://raw.githubusercontent.com/vdaas/vald/${VERSION}/charts/vald-helm-operator/crds/valdhelmoperatorrelease.yaml
After upgrading CRDs, please upgrade the operator.
If you’re using valdhelmoperatorrelease (or vhor) resource, please update the spec.image.tag field of it.
On the other hand, please update the operator’s deployment manually.
After that, please update image.tag field in your valdrelease (or vr) resource.
The operator will automatically detect the changes and update the deployed Vald cluster.